Downloading Data on Directors' Dealings
Introduction
Directors’ dealings are financial securities transactions, especially in shares, of executives targeting their employer resp. company. In Germany such transactions fall under § 15a WpHG which is the German securities trading act. By law directors’ dealings have to be reported to the BaFin (federal agency for financial market supervision). The BaFin makes these dealings publicly accessible via their website, see here. This article provides R code for downloading data on directors’ dealings and generating relevant visualisations.
The Design
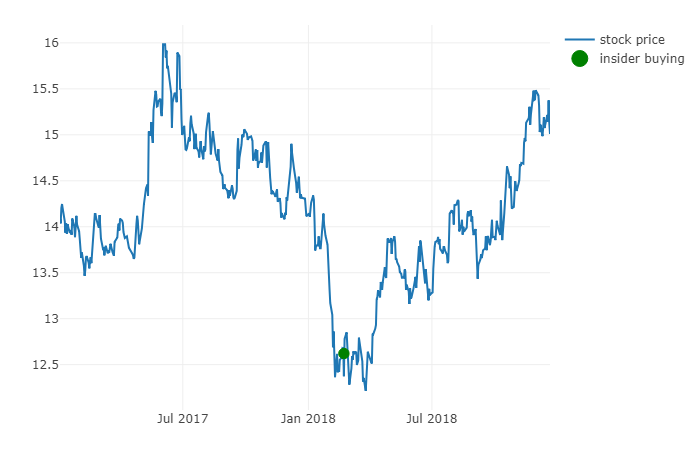
The following codes allows to output an interactive plot visualising directors’ buying (green) and selling (red) along the evolution of the target company’s share price. An example is the below plot for Deutsche Telekom AG (ISIN: DE0005557508).
To generate a plot run the below main.R file. Two parameters have to be set:
- Specify a target company via its ISIN, in the Deutsche Telekom AG example this would be
isin <- "DE0005557508". - Set the start date
quotes_start_datefrom which on stock price quotes are downloaded. As BaFin’s database stores directors’ dealings for up to 12 months the code’s default behaviour is to download stock data for the matching 12 months period. If a longer price history is required (then without potential directors’ dealings), setquotes_start_dateto a date prior to the current date minus 12 months.
#
# analysis of directors dealings reported to BaFin
#

rm(list = ls())

library("plotly")
library("reshape2")

source("src/directors_dealings.R")
source("src/helpers.R")
source("src/market_data.R")

# parameters
isin <- "DE0005557508" #
quotes_start_date <- as.Date("2017-01-01", "%Y-%m-%d")

config_path <- "config/isin_symbol_mapping.txt"

# download directors dealings
dealings <- directors_dealings(isin)
dealings <- dealings_summary(dealings)

min_date <- min(c(quotes_start_date, min(dealings$date)))
max_date <- Sys.Date()

# download stock quotes
symbol_map <- load_isin_symbol_map(config_path)
symbol <- symbol_map[[isin]]

stock_quotes <- market_data(
  symbol = symbol,
  from   = min_date,
  to     = max_date
)

# plot results
deal_data <- melt(dealings, id = "date")
deal_data$y <- stock_quotes$quote[which(stock_quotes$date %in% deal_data$date)]

buy_data <- deal_data %>% filter(variable == "buy" & value != 0)
sell_data <- deal_data %>% filter(variable == "sell" & value != 0)

p <- plot_ly(
  stock_quotes,
  x = ~date,
  y = ~quote,
  type = "scatter",
  mode = "lines",
  showlegend = TRUE,
  name = "stock price"
) %>%
  layout(
    xaxis = list(title = ""),
    yaxis = list(title = "")
  )

if (nrow(buy_data) > 0) {
  p <- p %>%
  add_markers(
    data = buy_data,
    x = ~date,
    y = ~1.02*y,
    size = ~value,
    hoverinfo = "text",
    text = ~paste0(
      "Date: ", date,
      "Type: ", "Buy",
      "Volume: ", format(round(value, 0), big.mark=",", scientific = FALSE)
    ),
    marker = list(opacity = 1, color = "green", line = list(color = "green")),
    showlegend = TRUE,
    name = "insider buying"
  )
}

if (nrow(sell_data) > 0) {
  p <- p %>%
  add_markers(
    data = sell_data,
    x = ~date,
    y = ~0.98*y,
    size = ~value,
    hoverinfo = "text",
    text = ~paste0(
      "Date: ", date,
      "Type: ", "Sell",
      "Volume: ", format(round(value, 0), big.mark=",", scientific = FALSE)
    ),
    marker = list(opacity = 1, color = "red", line = list(color = "red")),
    showlegend = TRUE,
    name = "insider selling"
  )
}

ggplotly(p)

htmlwidgets::saveWidget(p, paste0(isin, ".html"))
The actual functionality running a web request on the BaFin’s website is implemented in the next two sections. The remaining code of this section is the content of a source file helpers.R and allows to load and process the below config file isin_symbol_mapping.txt which serves the following purpose: As stock price quotes are retrieved from finance.yahoo.com via the R package BatchGetSymbols a mapping from the target company’s ISIN to the corresponding Yahoo symbol has to be implemented. The symbol for Deutsche Telekom AG would be DTE.DE. Note that the stated config implements the mapping for all German DAX companies. When running the code for a non DAX company, simply add the corresponding line to the config file.
DE000A1EWWW0,ADS.DE#Adidas
DE0008404005,ALV.DE#Allianz
DE000BASF111,BAS.DE#BASF
DE000BAY0017,BAYN.DE#Bayer
DE0005200000,BEI.DE#Beiersdorf
DE0005190003,BMW.DE#Bayerische Motoren Werke
DE0005439004,CON.DE#Continental
DE0006062144,1COV.DE#Covestro
DE0007100000,DAI.DE#Daimler
DE0005140008,DBK.DE#Deutsche Bank
DE0005810055,DB1.DE#Deutsche Börse
DE0005552004,DPW.DE#Deutsche Post
DE0005557508,DTE.DE#Deutsche Telekom
DE000ENAG999,EOAN.DE#EON
DE0005785604,FRE.DE#Fresenius
DE0005785802,FME.DE#Fresenius Medical Care
DE0006047004,HEI.DE#HeidelbergCement
DE0006048408,HEN3.DE#Henkel
DE0006231004,IFX.DE#Infineon
DE0006483001,LIN.DE#Linde
DE0008232125,LHA.DE#Lufthansa
DE0006599905,MRK.DE#Merck
DE0008430026,MUV2.DE#Muenchener Rueck
DE0007037129,RWE.DE#RWE
DE0007164600,SAP.DE#SAP
DE0007236101,SIE.DE#Siemens
DE0007500001,TKA.DE#ThyssenKrupp
DE0007664005,VOW3.DE#Volkswagen
DE000A1ML7J1,VNA.DE#Vonovia
DE0007472060,WDI.DE#Wirecard
load_isin_symbol_map <- function(path) {
  tab <- read.table(path, sep = ",", stringsAsFactors = FALSE)

  n <- nrow(tab)
  map <- vector("list", n)

  for (i in 1 : n)
    map[i] <- tab[[2]][[i]]

  names(map) <- tab[[1]]

  return(map)
}
Accessing Financial Market Data
While there exist quite a few vendors for free stock quote data, keeping track of the available APIs is tedious: As the time of writing major websites stopped their APIs. Thus, the related R packages for requesting data from Yahoo and Co. no longer do the job. The best option I could find is the BatchGetSymbols package for R. The below code is a wrapper for the package’s functionality and is used for downloading both historical stock price quotes and historical foreign exchange rates. The latter are needed when the target company’s shares were bought in a foreign currency, e.g. US dollar. The code uses the exchange rates to convert all figures to EUR. In order to use and source (see above main.R) the code, paste it into a file market_data.R.
library("BatchGetSymbols")

market_data <- function(symbol, from, to) {
  query_result <- BatchGetSymbols(
    tickers      = symbol,
    first.date   = from,
    last.date    = to,
    freq.data    = "daily",
    cache.folder = file.path(tempdir(), "BGS_Cache")
  )$df.tickers

  return(data.frame(
    date  = query_result$ref.date,
    quote = query_result$price.adjusted
  ))
}
Accessing Data on Directors' Dealings
The actual logic downloading and preparing the directors’ dealings data is implemented by the subsequent code which is the content of a file directors_dealings.R. Granted, the implementation is not the nicest, but it does the job. Four functions are required:
directors_dealings(isin): Runs the actual web request for a single specifiedisinfetching raw table data from BaFin’s website.dealings_summary(dealings_table): Converts the output ofdirectors_dealingsinto a dataframe of daily amounts of insider deals (buy and sell). This includes aggregating individual insider transactions on a particular day and converting non EUR figures into EUR amounts.aggregate_transactions(data, date, dir, fx_map): Helper function for aggregating individual deals for specifieddirin {BUY_FLAG,SELL_FLAG}.get_fx(fx, date, map): Extracts the CCYEUR exchange rate applicable fordatefrom currencymap.
library("dplyr")
library("rvest")

source("src/market_data.R")

DATE_FORMAT_BAFIN <- "%d.%m.%Y"
BUY_FLAG <- "Kauf"
SELL_FLAG <- "Verkauf"

directors_dealings <- function(isin) {
  stopifnot(is.character(isin), length(isin) == 1)

  url <- "https://portal.mvp.bafin.de/database/DealingsInfo/"
  form_name <- "sucheForm.do"
  session <- html_session(paste0(url, form_name))
  form <- html_form(session)[[1]]

  form <- set_values(form, emittentIsin = isin)
  session <- submit_form(session, form)

  bafin_data <- paste0(
    url,
    read_html(session) %>%
      html_nodes(xpath = "//div[@class=\"exportlinks\"]//a") %>%
      xml_attrs("a") %>%
      first()
  ) %>%
    data.table::fread()

  return(bafin_data)
}

dealings_summary <- function(dealings_table) {
  stopifnot(is.data.frame(dealings_table))
  stopifnot("Durchschnittspreis" %in% colnames(dealings_table))

  date_col_index <- grep("Datum des G", colnames(dealings_table))
  stopifnot(date_col_index > 0)
  colnames(dealings_table)[date_col_index] <- "date"

  dir_col_index <- grep("Art des G", colnames(dealings_table))
  stopifnot(dir_col_index > 0)
  colnames(dealings_table)[dir_col_index] <- "dir"

  vol_col_index <- grep("Aggregiertes Volumen", colnames(dealings_table))
  stopifnot(vol_col_index > 0)
  colnames(dealings_table)[vol_col_index] <- "volume"

  dtmp   <- strsplit(dealings_table$Durchschnittspreis, " ")
  dprice <- sapply(dtmp, function(item) { return(as.numeric(gsub(",", ".", item[1]))) })
  dcur   <- sapply(dtmp, function(item) { return(item[2]) })

  ddate <- as.Date(dealings_table$date, DATE_FORMAT_BAFIN)
  udate <- sort(unique(ddate))

  ucur <- unique(dcur)
  ucur <- ucur[which(ucur != "EUR")]

  min_date <- min(udate)
  max_date <- max(udate)

  l_fx <- list()

  for (cur in ucur) {
    fx_query <- market_data(
      symbol = paste0(cur, "EUR=X"),
      from   = min_date,
      to     = max_date
    )
    l_fx[[cur]] <- fx_query
  }

  res <- matrix(rep(0, 2*length(udate)), ncol = 2)

  for (i in seq_along(udate)) {
    d <- udate[i]
    stab <- dealings_table[which(d == as.Date(dealings_table$date, DATE_FORMAT_BAFIN)), ]

    buy <- aggregate_transactions(
      data   = stab,
      date   = d,
      dir    = BUY_FLAG,
      fx_map = l_fx
    )

    sell <- aggregate_transactions(
      data   = stab,
      date   = d,
      dir    = SELL_FLAG,
      fx_map = l_fx
    )

    res[i, ] <- c(buy, sell)
  }

  res <- as.data.frame(res)
  colnames(res) <- c("buy", "sell")
  res$date <- udate

  return(res)
}

aggregate_transactions <- function(data, date, dir, fx_map) {
  index <- which(dir == data$dir)

  if (length(index) == 0) return(0)

  stab  <- data[index, ]
  cur   <- sapply(strsplit(stab$volume, " "), function(item) { return(item[2]) })
  fx    <- rep(1, length(cur))

  for (i in seq_along(cur)) {
    tcur <- cur[i]
    if (tcur != "EUR")
      fx[i] <- get_fx(tcur, date, fx_map)
  }

  volume <- sapply(strsplit(stab$volume, " "), function(item) {
    return(as.numeric(gsub(",", ".", gsub("\\.", "", item[1]))))
  })

  return(sum(volume * fx))
}

get_fx <- function(fx, date, map) {
  data <- map[[fx]]
  ndate <- data$date[which(abs(data$date - date) == min(abs(data$date - date)))]

  return(data$quote[which(data$date == ndate)])
}